Twitter can be an amazing place. I happened on this tweet the other day and knew immediately what my response would be, but I also knew I couldn’t fit that response in a tweet.
My biggest “Wait… wut?” moment came in the Naval War College (NWC) Archives. I was looking at a series of “fighting strength comparisons” that the NWC had produced in 1929 while preparing for the London Conference of 1930. The comparisons were graphed curves that showed relative fighting strengths of different ships—mostly cruisers—at various ranges. Each curve compared two different ship types against each other.
To generate the curves, the NWC had used their standard fire effect calculations. Each ship could inflict a certain amount of damage in a three minute interval. Each ship also had a certain amount of “life” or survivability. Both damage and “life” were expressed in terms of 14-inch shell hits. That made it straightforward to compare fighting strength visually in a graph. Each line represented the percentage of “life” that one ship could take away from the other in a three minute turn at various ranges.

Most of the diagrams were very similar to the one above, a comparison of two “treaty cruisers” built after the Washington Treaty of 1922. Many of these ships were relatively close in terms of fighting strength and life, so the curves were broadly similar. Note that the ranges are expressed in thousands of yards and inside about 7,000 yards, these two ships could wreck each other very quickly.
Then I came to Diagram 16.
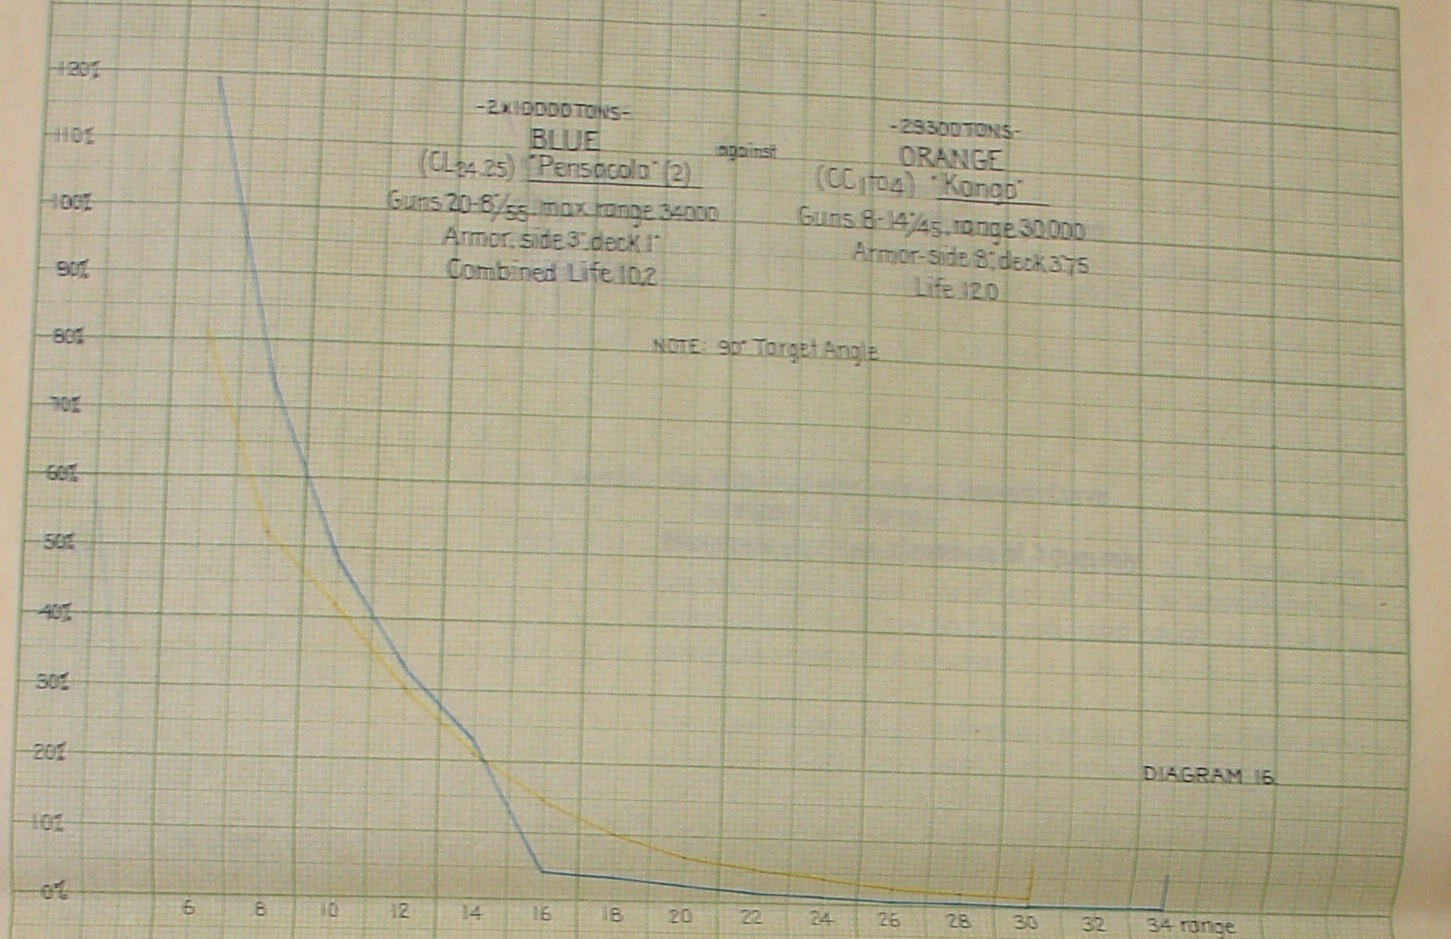
Diagram 16 compared two US Navy Pensacola class cruisers against one Imperial Japanese Navy (IJN) Kongo-class battle cruiser. This curve was different. At 16,000 yards, the Kongo had a distinct advantage because of superior armor. Inside 10,000, the increasing weight of shell from the two cruisers gave them an advantage and that advantage grew as the range closed.
But the “Wait… wut?” came with Diagram 17.
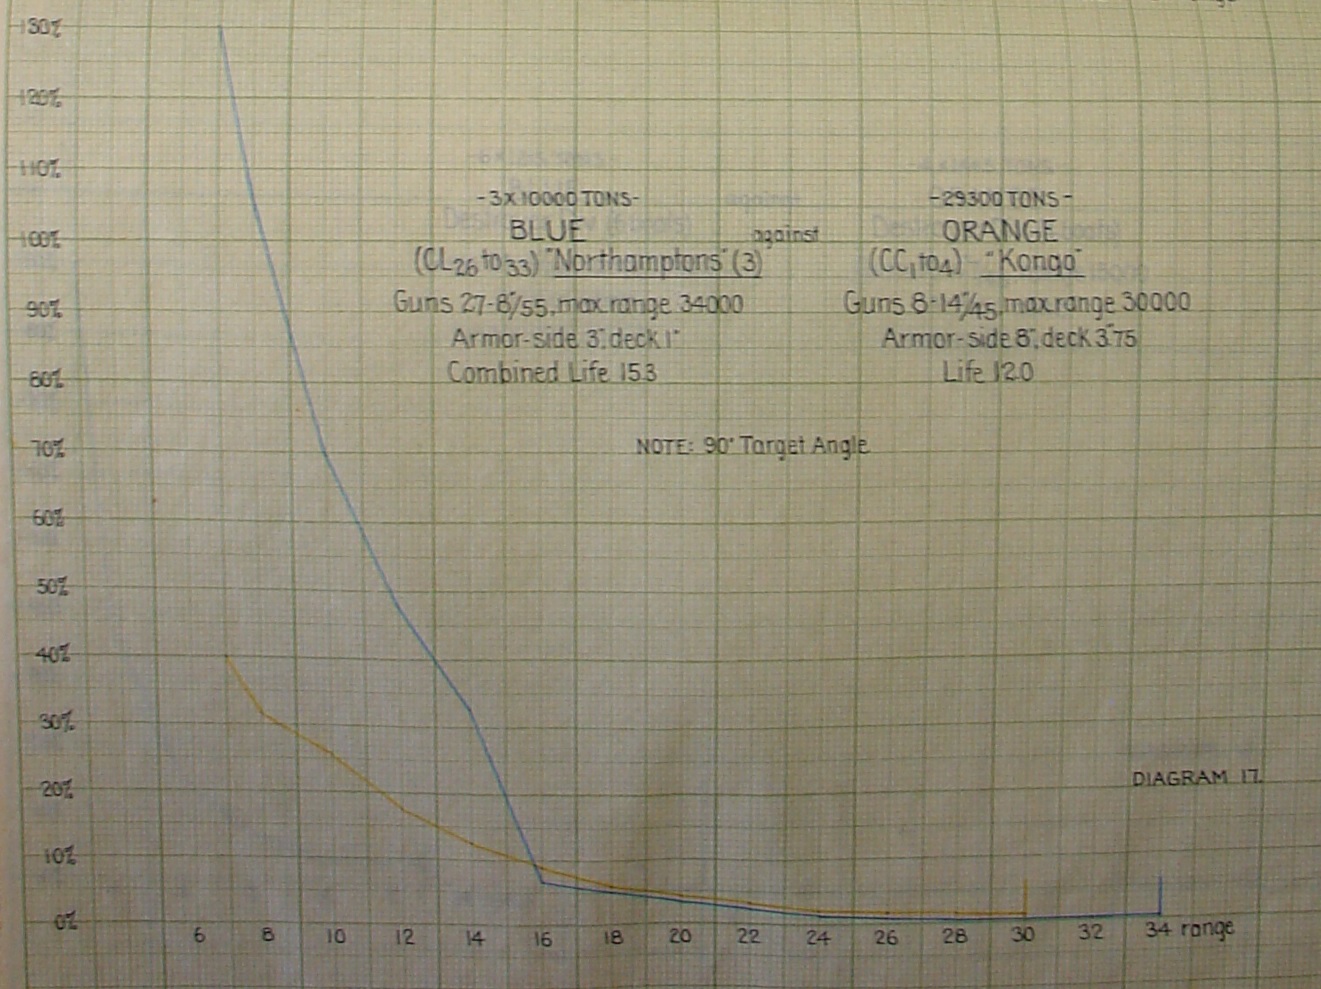
I couldn’t believe it when I saw this diagram. With three large US Navy cruisers against a single Kongo-class battle cruiser it mapped exactly to what Rear Admiral Daniel J. Callaghan tried to do in the early morning hours of 13 November 1942 in the First Naval Battle of Guadalcanal.
From surviving TBS logs and various accounts of the battle, I already knew that Callaghan tried to maneuver his three large cruisers—San Francisco, Portland, and Helena—as a unit and close the range with Hiei, a Kongo-class ship. His plan largely failed, but Diagram 17 explained why he tried, and why the attempt made sense to him at the time!
According to the diagram, the advantage three US Navy cruisers had at 10,000 yards was enormous. They could inflict 70% damage on the Kongo and only suffer 25% damage in return. At closer ranges, the advantage increased. At 7,000 yards, the cruisers could do 130% damage and only suffer 40% in return. No wonder Callaghan thought his cruisers could decide the battle.
To help illustrate that point, I included a graphical illustration of these diagrams in Learning War.
